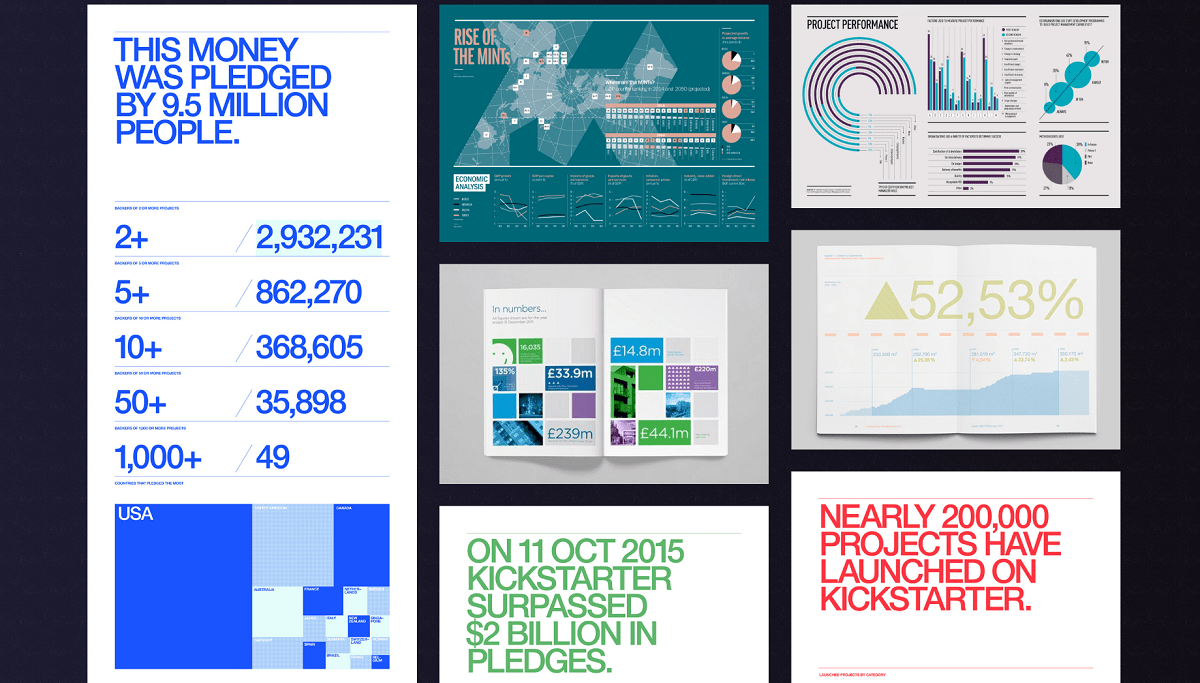
- 📊 Transform complex data, statistics, and information into clear and engaging infographic designs.
- 📈 Visualize numbers and trends using charts, graphs, timelines, diagrams, and comparison elements.
- 🎨 Combine typography, icons, illustrations, colors, and graphic elements to create a cohesive visual presentation.
- 🧩 Organize large amounts of information into structured sections that are easy to scan and understand.
- 🔢 Highlight key statistics, percentages, comparisons, findings, and important data points with strong visual emphasis.
- ✨ Create modern, corporate, educational, editorial, or creative infographic styles based on your content.
- 📐 Prepare high-resolution infographic designs suitable for websites, presentations, reports, social media, and printing.


Reviews
There are no reviews yet.